Futures trading is one of the most exciting ways to participate in the financial markets. However, compared to spot, trading futures without a clear strategy can quickly lead to losses. That’s where the best indicators for futures trading come in. These tools help shrewd traders analyze price action, identify opportunities, and manage risks effectively.
Using the right futures trading indicators can make the difference between consistent profits and constant frustration. Whether you are a beginner or an experienced trader, knowing which technical indicators for futures trading work best is essential.
The right indicators reveal hidden trends, measure momentum, and guide you on when to enter or exit trades.
The truth is, there is no single “magic” indicator. Instead, traders combine different trend indicators for futures trading with momentum indicators for futures to build reliable systems. In this guide, you will discover the best technical indicators for futures, how they work, and why they matter.
By the end, you will understand how to choose the right indicators for your style of trading—whether you focus on day trading futures indicators or prefer longer-term strategies. Let’s dive in and explore the tools that professional traders use to stay ahead in the futures markets.
What Are Futures Trading Indicators?
Futures trading indicators are technical tools used to analyze past and current price data. They help traders forecast potential price movements in the futures market. By highlighting trends, momentum shifts, and volatility levels, these tools assist in making more informed trading decisions.
There are two main types of futures trading indicators: leading vs lagging indicators futures.
Leading indicators attempt to predict future price action, while lagging indicators confirm trends after they begin. Both types are valuable, but they serve different purposes depending on your strategy.
When applied correctly, technical indicators for futures trading can improve your timing, strengthen risk management, and help you avoid costly mistakes.
Why Indicators Matter in Futures Trading
Trading futures (see glossary for meaning) requires both skill and discipline. Without the right tools, many traders rely on guesswork and emotions. This often leads to losses that could have been avoided. That’s why the best indicators for futures trading are essential.
Using futures trading indicators helps traders see patterns that are invisible to the naked eye. These tools highlight entry and exit points, show momentum, and confirm overall market direction. By doing so, they reduce uncertainty and improve decision-making.
Another benefit of technical indicators for futures trading is risk management. Futures markets are highly volatile, and prices can move quickly. Indicators such as average true range (ATR) or volume indicators allow traders to measure volatility and manage position sizes effectively.
For short-term traders, day trading futures indicators provide quick signals to act on fast price movements. For longer-term strategies, trend indicators for futures trading help identify bigger market cycles. In both cases, the right indicators improve accuracy and protect capital.
Ultimately, the goal of using the best technical indicators for futures is not to eliminate risk but to manage it. With discipline and the right tools, traders can turn uncertainty into opportunity.
10 Best Indicators for Futures Trading
When it comes to building a strong trading strategy, selecting the right tools is critical. The best indicators for futures trading are designed to identify trends, measure momentum, and signal potential reversals.
No single tool is perfect, but when combined, these futures trading indicators can give traders a reliable edge in the markets.
Let’s break down the top technical indicators for futures trading that professionals and beginners alike use to sharpen their strategies.
1. Moving Averages (MA, EMA, SMA)
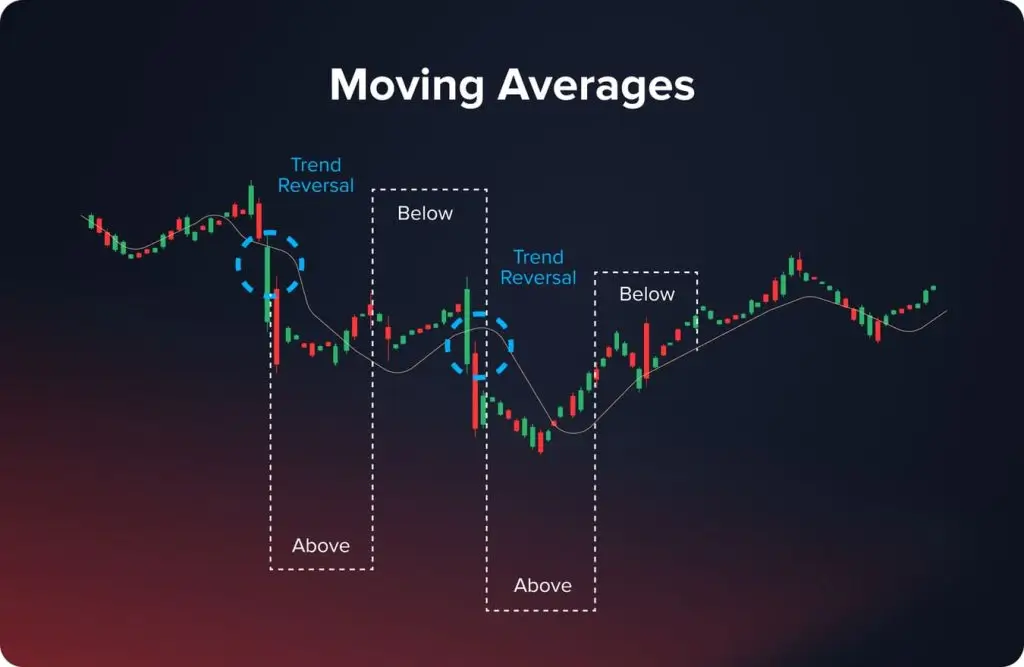
One of the most popular trend indicators for futures trading is the moving average. It smooths out price data over a set period, helping traders identify the direction of the market. The two main types are the simple moving average (SMA) and the exponential moving average (EMA).
The SMA calculates the average price over a chosen period, such as 50 or 200 days. It is slower to react to price changes but works well for spotting long-term trends. The EMA, on the other hand, gives more weight to recent prices. This makes it more responsive, which is useful for day trading futures indicators.
Traders use moving averages in several ways. A common strategy is the moving average crossover, where a short-term EMA crosses above a long-term SMA, signaling a potential uptrend.
Conversely, when the short-term EMA drops below the long-term SMA, it suggests a possible downtrend.
Another valuable use of moving averages in futures trading indicators is dynamic support and resistance. Prices often bounce around major moving averages, giving traders clear areas to enter or exit trades.
While moving averages are powerful, they are also lagging indicators futures. This means they confirm trends after they have already started. To improve accuracy, traders often combine them with momentum indicators for futures like RSI or MACD.
2. Relative Strength Index (RSI)
The relative strength index (RSI) is one of the most trusted momentum indicators for futures. It measures the speed and strength of price movements over a period, usually 14 days. The RSI moves between 0 and 100, giving traders insight into whether a futures contract is overbought or oversold.
An RSI reading above 70 suggests the market may be overbought, signaling a possible pullback. A reading below 30 indicates oversold conditions, hinting at a potential bounce. Many traders rely on these signals for day trading futures indicators, where quick reversals are common.
The strength of RSI is its ability to highlight momentum shifts before they appear on price charts. However, it can sometimes give false signals in strong trends. To counter this, traders combine RSI with trend indicators for futures trading, such as moving averages or Bollinger Bands.
3. Moving Average Convergence Divergence (MACD)
The MACD is another powerful tool among the best technical indicators for futures. It compares two moving averages of price—the 12-period EMA and the 26-period EMA. The MACD line is then compared to a signal line (usually a 9-period EMA) to generate trading signals.
When the MACD line crosses above the signal line, it suggests bullish momentum. When it crosses below, it indicates bearish momentum. These crossovers are highly effective for timing entries and exits in futures trading indicators strategies.
Another feature of MACD is divergence. If prices make new highs but the MACD fails to confirm, it signals weakening momentum and a possible reversal. This makes MACD one of the best momentum indicators for futures.
4. Bollinger Bands
Bollinger Bands are volatility-based technical indicators for futures trading. They consist of a middle SMA with two bands placed above and below it, usually set two standard deviations away. These bands expand and contract based on market volatility.
When the bands tighten, it signals low volatility and a potential breakout. When they widen, it shows increased volatility. Prices that touch or move outside the bands often signal overbought or oversold conditions. This makes Bollinger Bands useful for both day trading futures indicators and longer-term strategies.
Traders often use Bollinger Bands alongside momentum indicators for futures like RSI. A price touching the upper band with an RSI above 70 is a strong warning of overbought conditions.
5. Fibonacci Retracement
The Fibonacci retracement tool is one of the most widely used futures trading indicators for identifying support and resistance levels. It is based on key Fibonacci ratios such as 38.2%, 50%, and 61.8%.
After a significant price move, traders apply Fibonacci retracement levels to find possible pullback zones. For example, if a futures contract rallies and then begins to fall, traders look for support around the 38.2% or 61.8% retracement level.
This indicator is especially popular in trend indicators for futures trading. Traders wait for pullbacks to Fibonacci levels to enter trades in the direction of the larger trend.
While not always exact, these levels are respected in many markets and often align with other technical indicators for futures trading.
6. Stochastic Oscillator
The stochastic oscillator is a momentum tool that compares a futures contract’s closing price to its price range over a set period. Like RSI, it ranges from 0 to 100. Readings above 80 suggest overbought conditions, while readings below 20 indicate oversold conditions.
One advantage of the stochastic oscillator is its sensitivity. It reacts quickly to price changes, making it a favorite among day trading futures indicators. Traders use it to catch short-term reversals before they appear on price charts.
However, sensitivity can also be a weakness. In strongly trending markets, the stochastic oscillator can stay overbought or oversold for long periods. This is why traders often combine it with trend indicators for futures trading, like moving averages.
7. Volume Indicators (OBV, VWAP)
Volume plays a major role in confirming price moves. Among the best indicators for futures trading, volume indicators such as On-Balance Volume (OBV) and the Volume Weighted Average Price (VWAP) are highly effective.
OBV measures buying and selling pressure by adding volume on up days and subtracting it on down days. A rising OBV confirms bullish trends, while a falling OBV confirms bearish ones. This makes OBV a reliable technical indicator for futures trading.
VWAP, on the other hand, calculates the average price weighted by volume throughout the trading day. It is often used as a benchmark by institutional traders.
Prices above VWAP suggest bullish strength, while prices below indicate bearish pressure. For day trading futures indicators, VWAP is particularly valuable.
8. Average True Range (ATR)
The average true range (ATR) is a volatility-based tool. It measures the average range between high and low prices over a set period. Unlike other futures trading indicators, ATR does not indicate trend direction—it only measures volatility.
High ATR values indicate significant price fluctuations, which can lead to greater profit opportunities but also increased risk. Low ATR values indicate quieter markets with smaller price fluctuations. Traders use ATR to set stop-loss levels, making it a vital tool for risk management.
For day trading futures indicators, ATR helps traders decide position size and stop distances. In longer-term strategies, it is useful for assessing whether a market is too volatile to trade.
9. Ichimoku Cloud
The Ichimoku Cloud is one of the most comprehensive technical indicators for futures trading. It consists of multiple lines and a shaded cloud area that shows support, resistance, trend direction, and momentum all in one view.
If the price is above the cloud, the market is considered bullish. If it is below, the market is bearish. The thickness of the cloud also indicates the strength of the support or resistance zone.
While it may look complex, the Ichimoku Cloud is powerful because it combines several trend indicators for futures trading in one system. Many traders use it to identify long-term trends and confirm breakout signals.
10. Pivot Points
Pivot points are another classic tool among the best indicators for futures trading. They are calculated using the previous day’s high, low, and closing prices. From these, key support and resistance levels are derived.
Day traders love pivot points because they provide ready-made levels to watch during the trading session. Prices often bounce around these levels, making them useful for quick trades. This makes them one of the most practical day trading futures indicators.
Pivot points can be used alongside momentum indicators for futures to confirm entries and exits. For example, if RSI shows oversold conditions near a pivot support, traders see it as a stronger signal to buy.
How to Choose the Right Indicator for Your Futures Strategy
Not every trader uses the same set of tools. The best indicators for futures trading depend on your goals, risk tolerance, and style of trading. Choosing wisely ensures your strategy fits your market approach.
Day traders usually prefer fast-reacting tools like momentum indicators for futures such as RSI (number 2 above), Stochastic Oscillator (number 6), or VWAP (number 7). These day trading futures indicators generate quick signals, helping traders act on rapid price moves.
Swing traders, on the other hand, look for broader trends. They often rely on trend indicators for futures trading, like Moving Averages (number 1), MACD (number 3), or Ichimoku Cloud (number 9).
These indicators help spot long-term patterns and reduce noise from short-term fluctuations.
Risk management is another key factor. Indicators like ATR and volume-based tools help traders measure volatility and position sizing. When combined with the best technical indicators for futures, these tools improve both accuracy and safety.
The smartest approach is to backtest indicators on historical data before using them in live trading. By doing this, you’ll find the combination of futures trading indicators that best matches your trading personality.
Common Mistakes Traders Make with Indicators
Even the best indicators for futures trading won’t guarantee success if used incorrectly. Many traders fall into common traps that hurt performance.
One mistake is overloading charts with too many tools. While it’s tempting to add several futures trading indicators, too many signals can lead to confusion. This is often called “analysis paralysis.”
Another mistake is ignoring fundamentals. Technical indicators for futures trading are powerful, but they don’t reflect economic data, news, or geopolitical events. Relying only on charts can leave traders blind to big market movers.
Traders also misuse leading vs lagging indicators futures. For example, using a lagging indicator like a moving average for entry signals can result in late trades. It’s important to understand what each indicator is designed for.
Finally, many traders skip risk management. Indicators like ATR exist to help manage losses, but ignoring them can lead to blown accounts. Successful trading requires balancing analysis with discipline.
Pro Tips for Using Indicators Effectively
The difference between beginners and professionals often comes down to how indicators are applied. Here are some tips for getting the most from the best technical indicators for futures.
First, use a mix of tools. Combine trend indicators for futures trading with momentum indicators for futures. For example, pairing moving averages with RSI creates a balanced strategy.
Second, keep it simple. Choose two or three core futures trading indicators and master them instead of juggling many. This makes the analysis clear and reduces second-guessing.
Third, always backtest. Run your chosen setup on past market data. This shows how the system performs in different conditions and builds confidence.
Lastly, integrate indicators with strong risk management. Tools like ATR and volume-based indicators should guide stop-loss placement and position sizing. This ensures survival even when trades don’t go as planned.
FAQs on the Best Indicators for Futures Trading
Q: What is the most accurate indicator for futures trading?
A: There is no single “most accurate” tool. The best indicators for futures trading work better when combined. For example, using moving averages with RSI gives stronger confirmation than using either alone.
Q: Can beginners rely only on indicators?
A: Beginners can start with simple technical indicators for futures trading, but relying only on them is risky. It’s also important to learn fundamentals and practice risk management.
Q: Which indicators are best for day trading futures?
A: Popular day trading futures indicators include RSI, VWAP, Bollinger Bands, and the stochastic oscillator. These generate fast signals suited for short-term trades.
Q: Are there free tools to access these indicators?
A: Yes. Most trading platforms provide built-in futures trading indicators for free. Examples include TradingView, Thinkorswim, and MetaTrader. Many brokers also offer free charting tools with popular technical indicators for futures trading.
Conclusion
The best indicators for futures trading are essential tools for analyzing markets, managing risk, and timing trades.
From trend indicators for futures trading, like moving averages and MACD, to momentum indicators for futures such as RSI and Stochastic Oscillator, each tool serves a specific role.
The key is not to overload your charts but to choose a few reliable futures trading indicators that match your style. Whether you’re focused on day trading futures indicators or long-term strategies, the right combination improves consistency.
Trading futures is never without risk, but with discipline and the right tools, those risks can be managed. Start small, test your system, and let indicators guide you toward smarter decisions in the futures market.