
In the fast-paced world of cryptocurrency, significant price movements can occur in seconds. One rare yet eye-catching chart pattern is known as the Godzilla candle—a term gaining popularity among traders and cryptocurrency analysts. But what is a Godzilla candle in Bitcoin, and why should traders care?
This article will investigate the meaning, causes, implications, and real-life examples of this unusual but powerful candlestick formation. If you’re trying to make sense of sudden Bitcoin price spike patterns, this guide will walk you through everything you need to know.
Understanding the Godzilla Candle in Bitcoin
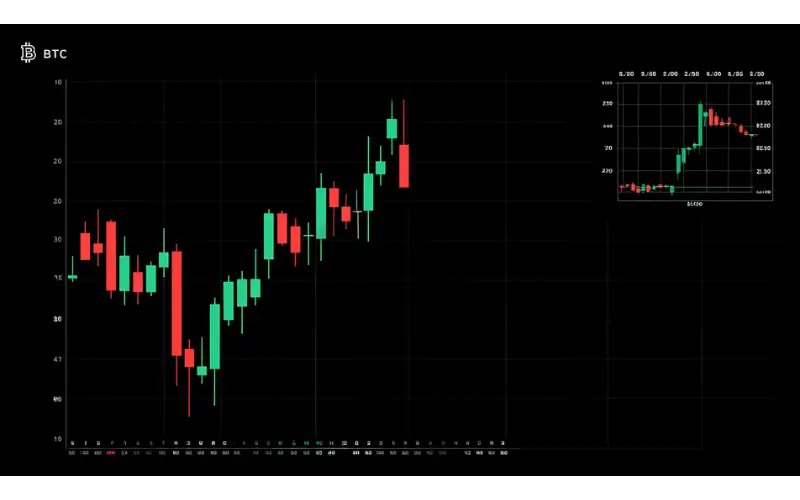
A Godzilla candle in Bitcoin refers to a massive candlestick on a chart, typically seen in short timeframes (like 1-minute or 5-minute charts), that shows a sudden and extreme price movement—either upward or downward. This candle is far larger than the surrounding candles, and often appears out of nowhere, signaling extreme market volatility.
The term “Godzilla” symbolizes the candle’s monstrous size and unexpected arrival, much like the fictional creature. Unlike standard Bitcoin candlestick patterns, this one tends to break all norms, confusing even experienced traders.
It can be bullish or bearish (check glossary for meaning), depending on the direction of the move.
What separates the Godzilla candle crypto pattern from traditional technical signals is its unpredictability and its association with either massive buy orders (possibly from whales) or rapid sell-offs.
It doesn’t follow typical indicators like RSI or MACD, making it harder to anticipate.
How to Identify a Godzilla Candle on a Bitcoin Chart
Spotting a Godzilla candle in Bitcoin is relatively easy due to its visual dominance on a chart. However, understanding what it truly signals requires a closer look.
Technical Indicators to Watch
A typical Godzilla candle overshadows the candles before and after it. It appears suddenly and often lacks buildup. If you are looking at the 1-minute, 5-minute, or even 15-minute charts, you will notice this sharp price movement with a long body and possibly tiny or no wicks.
While traditional crypto candle patterns rely on moving averages or stochastic oscillators (see glossary for meaning), the Godzilla candle is mostly a visual clue. That said, tools like Bollinger Bands may show a breakout far outside the upper or lower bands.
Volume spikes are another indicator. A Godzilla candle is usually backed by an enormous increase in trading volume. Look for unusual volume bars that line up with the candle’s timeframe—this could signify whale activity.
Timeframes That Usually Show It
The Bitcoin Godzilla candle often shows up on lower timeframes, where rapid movements are captured with precision. If you’re using a 1-minute chart, you may notice a candle that’s 5–10x the size of its neighbors.
On daily or weekly charts, such movements would be diluted into broader trends, and the pattern may not stand out as clearly. For traders using high-frequency bots or scalping strategies, the Godzilla candle is more relevant and more visible.
Common Visual Characteristics
The candle’s body is usually very long and dominates the chart space. Whether green (bullish) or red (bearish), it stands out due to its disproportionate size. There may be little to no wicks, suggesting that the price opened and closed near its high or low.
It’s not just about size, though. The surrounding candles also matter. A Godzilla candle often breaks out from a tight consolidation phase or appears after a fakeout move, making it more impactful.
What Triggers a Godzilla Candle in Bitcoin Trading?
Before you react to a Godzilla candle, it’s vital to understand what causes this type of explosive move. Several factors can be behind such a pattern.
Sudden Market Volatility
Crypto markets are known for their intense and spontaneous volatility. A surprise movement caused by liquidation cascades, whale trades (see glossary for meaning), or algorithmic bot actions can spark a Godzilla candle.
Bitcoin is especially prone to such spikes due to its massive trading volume and market dominance.
Volatility often feeds on itself—once price begins to move aggressively, it triggers stop-losses or limit orders, which add fuel to the fire, leading to longer candle bodies.
Whale Activity or Institutional Trading
One of the most common causes of a Godzilla candle crypto pattern is large-scale buying or selling by whales—entities that hold large quantities of Bitcoin.
When a whale dumps or scoops up a large order, it creates an immediate price impact.
Institutions using dark pools or high-frequency trading bots may also execute complex strategies that result in these sharp, short-lived spikes.
The retail market usually reacts to these moves with confusion or panic.
Major News, FUD, or FOMO Triggers
News—both real and fake—can trigger fast market reactions. Regulatory announcements, ETF approvals, exchange hacks, or sudden tweets from influential figures can result in Godzilla-sized candles within minutes.
FOMO (Fear of Missing Out) or FUD (Fear, Uncertainty, and Doubt) can push thousands of retail traders into placing impulsive orders, further exaggerating price moves and forming this wild candle shape.
See also: The News Category
Real Examples of Godzilla Candles in Bitcoin History
A few historical events provide perfect examples of the Godzilla candle in action.
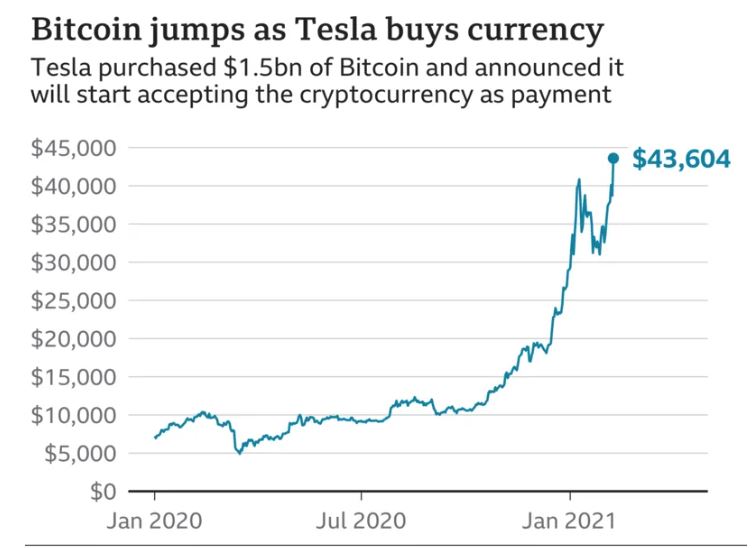
Example 1: Flash Rally After Tesla’s Bitcoin Announcement
In early 2021, when Tesla announced it had bought $1.5 billion worth of Bitcoin, the market erupted. On lower timeframes, traders saw enormous green candles that broke through multiple resistance levels within minutes—classic Bitcoin price spike patterns that resembled a Godzilla candle.
This was not only a price move but also a psychological trigger that resulted in massive retail and institutional activity. The resulting candlestick formation was tall, straight, and high-volume—Godzilla in every sense.
Example 2: Binance API Leak and Liquidation Spike
In late 2023, an API issue on Binance led to algorithmic misbehavior, which caused abnormal liquidations in Bitcoin futures. Within a few minutes, BTC dropped $2,000 before recovering. The candle on the 1-minute chart was immense—red, dominant, and scary-looking.
This kind of extreme volatility shows how fragile markets can be to technical glitches or panic reactions, and again, the Godzilla candle pattern emerged clearly.
What Does a Godzilla Candle Mean for Traders?
A Godzilla candle doesn’t necessarily indicate a clear market direction—it’s more of a wake-up call. Here’s what it may signal for different types of traders.
For day traders, it can represent opportunity or danger. If the candle is part of a trend continuation, they may jump in. But if it’s a one-off event, entering blindly can lead to losses.
Swing traders and long-term investors usually stay away from such noise unless it breaks significant support/resistance levels. The key takeaway is to treat the candle as a signal of market disruption—temporary or not.
Reading the context is important. Pairing the candle with other indicators like RSI divergence, moving averages, or volume trends can provide better trade decisions.
Tips on How to Trade When You Spot a Godzilla Candle
Not every Godzilla candle is worth chasing. Some are traps, while others may kick off huge trends. Here’s how you can stay ahead.
Caution vs Opportunity
Always observe the market structure before reacting. If the Godzilla candle breaks out from consolidation and is followed by a clean retest, it might be a good entry. But if it’s isolated, it could just be a liquidity hunt.
Jumping in mid-candle is risky—wait for the next candle to confirm the trend or signal a reversal.
Setting Stop Losses
Tight stop-losses can be dangerous in highly volatile moves. Give your trade some breathing space, especially when dealing with these large patterns.
Using ATR (Average True Range) can help set smarter stop levels that reflect recent volatility.
Waiting for Confirmation
The worst thing you can do is trade the candle blindly. Look for follow-up signals—a breakout, a retest, or a continuation. Let the market show its hand before risking capital.
Confirmation-based trading protects you from emotional decisions caused by shocking price movements.
Godzilla Candle vs. Other Volatility Candles
Large candles are not unique to the Godzilla pattern. Here’s how it compares to other crypto candle patterns.
Flash Crash
A flash crash is a sudden drop followed by a quick recovery. While it may form a Godzilla candle, the context here is panic and technical failure rather than directional conviction. It’s more chaotic and often isolated.
Bullish Engulfing
This traditional Bitcoin candlestick pattern shows a bullish reversal, where a green candle fully covers the red candle before it. While powerful, it’s more structured and less violent than a Godzilla candle.
Marubozu
A Marubozu is a candle with no wicks—strong conviction up or down. Godzilla candles can be Marubozus, but not all Marubozus are big enough to be Godzillas.
Long Wick Candles
These often indicate rejection or failed breakouts. A Godzilla candle may have long wicks, too, but the body is still usually dominant.
Risks of Trading Based on Godzilla Candles
While tempting, trading based on Godzilla candle crypto patterns can be risky.
First, these candles often occur during low-liquidity periods or unexpected news events, making it hard to predict follow-through. Whales can easily trap retail traders during such moves.
Second, emotional trading spikes after such candles. Traders may enter too late, leading to losses. Confirmation is always essential.
Lastly, bots and high-frequency algorithms thrive in chaos—humans don’t. Recognize that reacting emotionally to extreme moves can do more harm than good.
Frequently Asked Questions (FAQs)
Q1: What is a Godzilla candle in crypto?
A Godzilla candle in crypto refers to an extremely large candlestick that appears on a price chart, often within a short timeframe like 1-minute or 5-minute intervals. It represents a sudden, aggressive move in price—either upward or downward—and usually indicates extreme volatility. This type of candle stands out due to its size and is often caused by large market orders or unexpected news events.
Q2: Is a Godzilla candle bullish or bearish?
A Godzilla candle can be bullish or bearish, depending on its direction. If the candle is green and surges upward, it reflects intense buying pressure, often due to FOMO or whale accumulation. A red candle that drops sharply signals panic selling or mass liquidations. The key is to analyze the context and follow-up price action to determine if it’s a trend reversal or a fakeout.
Q3: How do I trade a Godzilla candle pattern?
To trade a Godzilla candle pattern, wait for confirmation after the candle forms. Jumping in too early can be risky due to fakeouts. Traders should observe whether the next few candles confirm the move (trend continuation) or reject it (reversal). It’s important to use stop losses, analyze volume, and avoid trading emotionally. High risk comes with high potential, so caution is key when handling such volatile crypto candle patterns.
Q4: Can bots create Godzilla candles in Bitcoin?
Yes, bots—especially high-frequency trading (HFT) bots—can contribute to Godzilla candles in Bitcoin. When automated systems detect certain price levels or liquidity gaps, they can execute large-scale trades within milliseconds, causing rapid price movements. Combined with low liquidity or cascading liquidations, these actions can result in the appearance of a Godzilla candle on the chart.
Final Thoughts
So, what is a Godzilla candle in Bitcoin? It’s a rare, massive, and emotionally-charged candlestick that signals extreme volatility and market movement—often caused by whales, bots, or news shocks. While it can bring profit, it also carries high risk.
The best way to approach this pattern is with respect. Understand the context, use proper risk management, and never trade based on emotion. Crypto is fast, but smart wins over fast in the long run.